Graceful Degradation in Computational Research
A framework for balancing innovation and longevity in research communication
What is Graceful Degradation?
Graceful degradation (GD) refers to software decay management practices that ensure that the core value of a digital product continues to be delivered even as its underlying technology becomes out of date. GD is both a technique and a philosophy that emphasizes a long-term mindset and designing products that will age well. Digital products designed with GD techniques will be modular, will include redundancy and failsafes, will minimize external dependencies, and will ensure value/content delivery over the long term, even at the cost of short-term drawbacks, such as some additional complexity for the user or designer. We believe that GD is highly relevant to tools and platforms for the dissemination of scholarly research, since these platforms are not merely content delivery mechanisms but also stewards of public knowledge.
In the context of interactive scholarly research content today, the most important aspect of GD is the need for a variety of output formats. This means designing research outputs that start with interactive, computationally rich features—like live visualizations, linked data, and executable code but retain value even if those layers degrade over time. Instead of binary outcomes (working vs. broken), GD enables a spectrum—from fully interactive environments to recorded demos, static images, and structured metadata.
A few reasons graceful degradation matters:
Interactive environments are fragile: They break. Dependencies shift. Servers go down. But if we plan for that, we can leave behind something useful—a static version, a recording, a snapshot.
We preserve more context: Even degraded, a bundle of narrative, data, and code is more valuable than a PDF alone.
Innovation needs room to fail: New approaches often face pushback with the refrain, “It won’t work in five years.” That may be true—but the fallback still contains the data, the code, the execution intent. Even if it’s broken, you can often make it work again if needed. That effort is usually not worth it—but for some research, it absolutely is.
Preservation is not one-size-fits-all: Most research has a short relevance window. But some projects matter for decades. Graceful degradation allows us to store enough to make that determination later, not prematurely flatten everything to a static snapshot.
The goal is not perfection or permanence. It’s resilience. And this mindset allows us to build tools and workflows that support modern scientific practices without sacrificing long-term preservation. And better preservation will incentivize adoption.
What is decay?
Decay is not the same as Graceful degradation, as GD implies decay management. Decay just happens, whereas GD is a response to decay (i.e. decay stewarding).
Decay via Graceful degradation results in different interactivity levels, i.e., as GD increases, interactivity diminishes.
Explicit curation, decay stewarding or additional packaging steps may not be required as the primary mechanisms for achieving GD. Existing or future infrastructure might automatically (by design/construction) degrade gracefully when certain services become unavailable. (E.g. a document that invokes a web service to retrieve some content, but which maintains a local cache of the content to fall back to when the live service is offline.)
The following figure proposes a framework for the graceful degradation of interactive research content. Increasing interactivity precedes graceful degradation. In order to achieve interactivity and to promote its adoption, these features need to be “risk-free.” Graceful degradation is our proposed path. Thus interactivity arrow (going up) on the left, graceful degradation (going down) on the right.

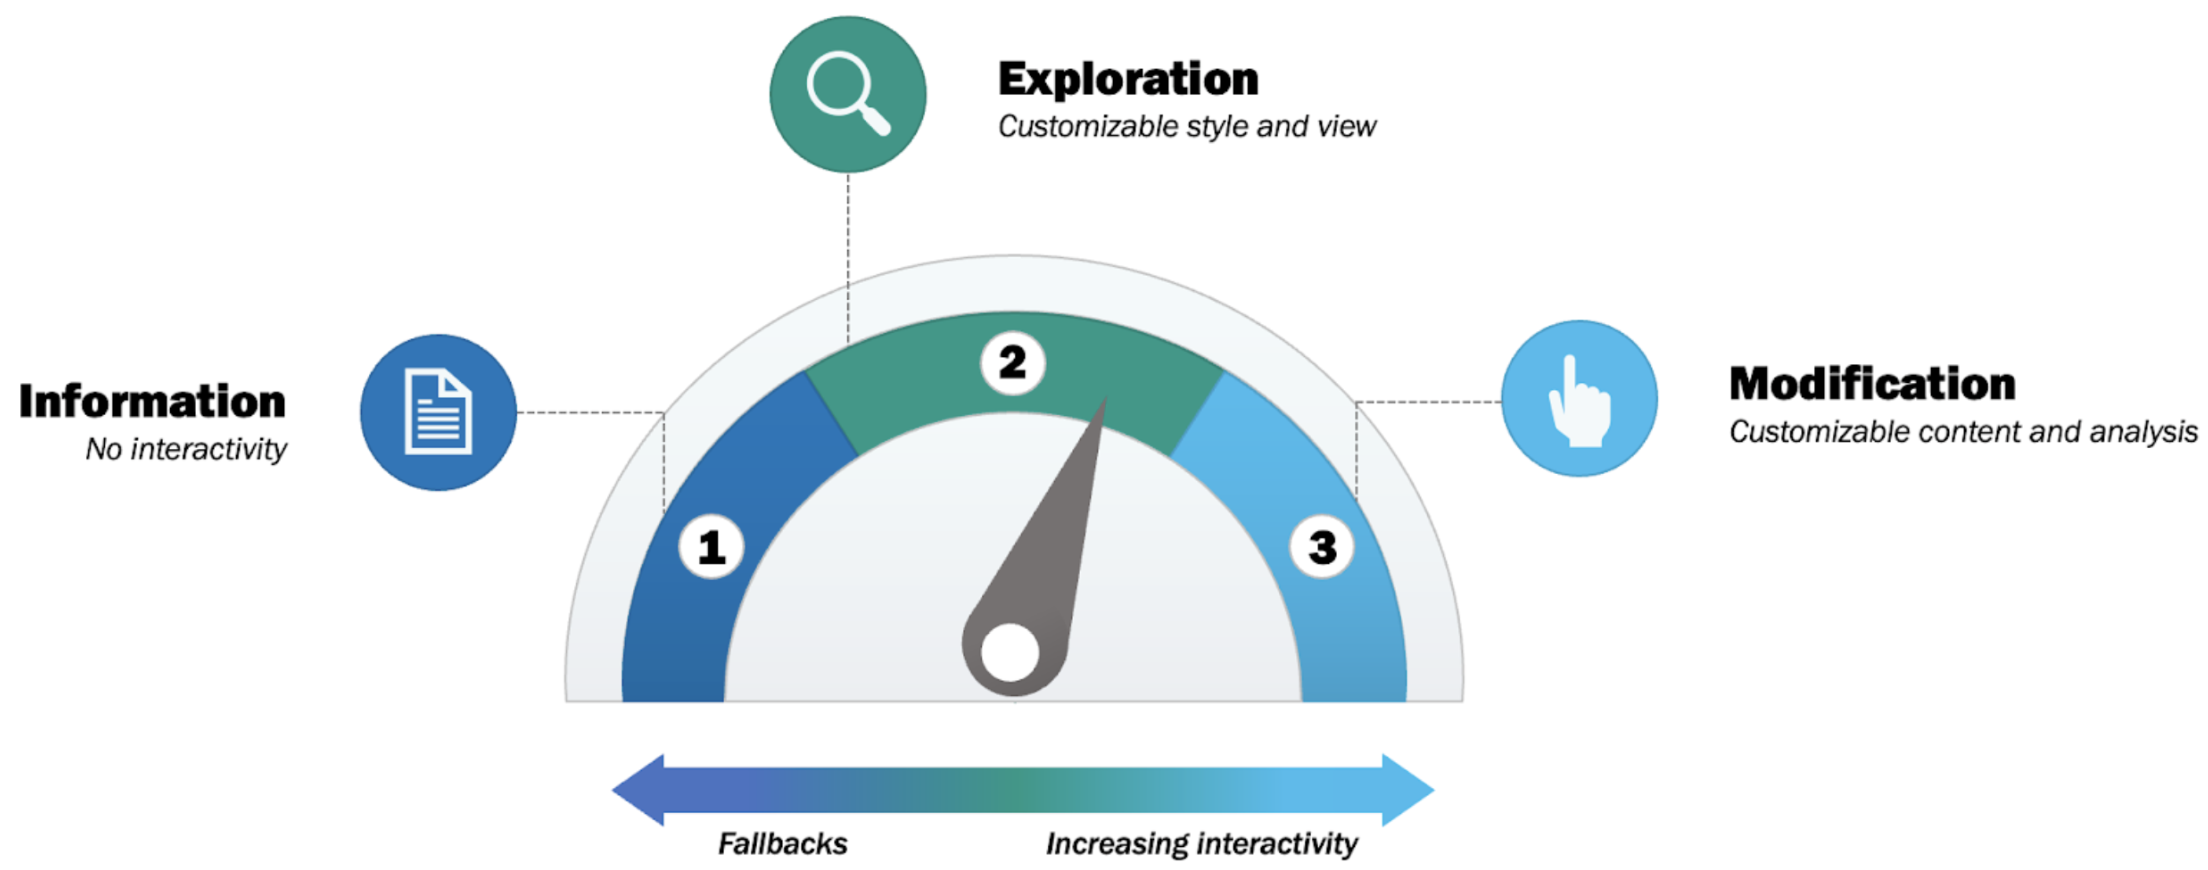
Levels
Within the table, three levels of interactivity are represented:
Level 3 (L3) Open-ended: corresponds to the work as the published object, fully interactive. This representation is created by the researcher and presents as an open-ended, unfettered exploration of data, code, visualisation and environment by the user or agent, examples being things like explorable explanations and online interactive papers, but also multiverse analyses (Sarma; Liu; Steegen). This opens up new models of collaboration, sharing and reuse.
Level 2 (L2) Predefined: corresponds to a partially decayed version of the published work with limited, set interactions, insofar as it is affected by some GD. Level 2 maintains interaction within pre-established parameters in figures, integration of up-to-date metadata on references, citations or links. Presentation-only controls do not affect underlying data.
Level 1 (L1) Static: corresponds to a fully decayed version of the published work, taken over by GD, i.e. the object is no longer computationally interactive, but does include data/code citations or links with appropriate standards (e.g. data citation principles). Content is fixed, but is marked or tagged for accessibility.
Columns
At each interactivity level, we include five columns, representing components of Text, Visualizations, Data, Code and Environment. Although there is some fluidity among these categories, it is helpful to think of them separately here as they may degrade in different ways. Expected interactions at Level 3 are described below:
Text
Text represents the written component of a research output. Interactions include:
Navigation (navigate to external resources, or to sections, figures or data within document)
Highlighting
Hyperlinks
In-text evaluations; updates to equations
Bounded LLM responses
Visualizations
Interactive visualizations allow for the manipulation of charts and figures. There is some overlap with data queries, but here we focus on features unique to visualization. Interactions include:
Navigation & focus (zoom, pan, scroll, e.g. on maps or timelines; “focus & context” lenses, fisheye views, thumbnails; drill-down into subregion of chart)
Highlighting & selection (“brushing” to highlight set of points; linked selections; hover tooltips that reveal exact values)
Aggregation and disaggregation (faceting; layering/overlays; unit charts)
Animation and guides (animation to help readers track continuity; scripted walkthroughs/guides)
Custom visual encodings (customise data bindings; switch colour palettes to aid visual impairment; toggle linear vs. log scales; switch chart type from bar ↔ line ↔ scatter to represent data differently)
Annotation & collaboration (personal annotation of visual elements; bookmarks that save visual state, e.g. zoom or selections; shareable views)
Dynamics & time (play/pause/step through time-series animations; scrub sliders)
Data
At L3, data is queryable within the published executable environment. As we move from L3 to L2, we lose direct access to the data or data pipelines. At L2, the data is no longer queryable in the execution environment but can be downloaded and queried in an external/local environment. At L1, there is simply no longer connected access to the data, and only a derivative representation of it is available to the user.
Interactions focus on in situ end-user interactions for manipulating tabular or array data embedded into research outputs and exploring impact on presented results.
Filtering & projection (restrict rows, e.g. “only show countries in Europe”, or select specific columns (“just the GDP and population fields”; drop or slice dimensions)
Sorting & ranking (e.g. sort by population descending, 10 largest cities)
Aggregation & disaggregation (e.g. roll up along a dimension with sum, mean, count, min/max; pivot; drill-down (e.g. continent → country → city))
Joining (merge dataset with another, e.g. enrich country GDP with population data)
Deriving new data (create new computed column, e.g. GDP per capita)
Code
Includes source code for L3 and binaries for L2, for example, but also code that executes the notebook. Can interact with code in a notebook cell, code buffer or prompt integrated into a research output. Interactions include:
Editing and re-execution (change code or data and re-run single cell or all dependent cells to regenerate output; run code fragment under mouse cursor)
Direct manipulation (widgets and sliders to manipulate parameters and auto-update output)
Debugging and runtime inspection (print variables, display data frames; step into/over; breakpoint)
Reproducibility and collaboration (checkpoint/share notebook state)
Environment
Interactions with the overall “container” for the code above include:
Configuration and dependency management (swap out libraries, manage versions, upgrade dependencies)